VMware vRealize Log Insight (formerly vCenter Log Insight)

VRealize Log Insight is a log collection and analytics virtual appliance that enables administrators to collect, view, manage and analyze syslog data.
Log Insight provides real-time monitoring of application logs, network traces, configuration files, messages and performance data. This makes any unstructured logs easy to view and organize.
VRealize Log Insight features
Log Insight gives administrators the ability to manage infrastructure, consolidate logs, monitor and troubleshoot vSphere and IT environments, as well as perform security auditing and compliance testing. This is accomplished by placing an agent on each monitored device that collects analytics data on performance, state and logs.
VRealize Log Insight includes a syslog server, a log consolidation tool and a log analysis tool that work for any type of device that can send syslog data. Syslog data can still be collected even if the monitored device doesn't have conventional ways to log messages. If the monitored device or software does not support syslog -- such as Windows Server -- then a Log Insight agent can be installed on the device.
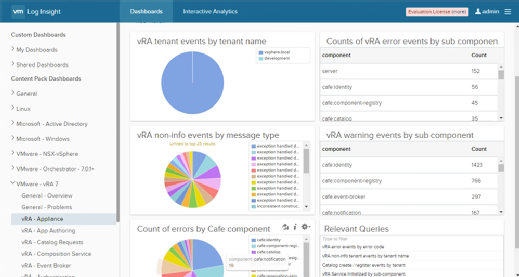
The vRealize Log Insight appliance has an HTML5 web interface and features dashboards composed of customizable widgets that can tailor the layout of graphs, reports and alerts. The dashboards depict events, errors and warnings. Administrators can also create custom dashboards based on saved queries, which can then be exported and shared. The user interface also features a search function.
For example, if an administrator wants to monitor the status of a firewall, an agent can be installed on the firewall server to collect and send data to vRealize Log Insight for reporting and analysis. If there is an event, error or warning, the software will alert the user via a previously set alarm -- such as a critical or storage alarm. VRealize Log Insight will display the analyzed firewall data through a graphical user interface (GUI), which can include graphs and charts.
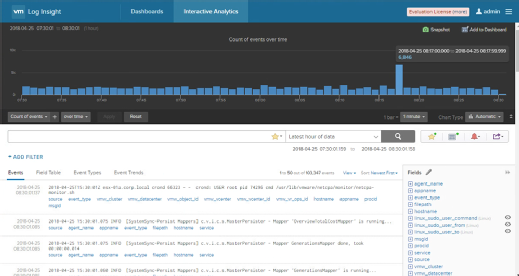
The GUI-based interface quickens searches by using extract fields. An extract field creates context for messages and data collected by adding metadata to the collected data, which makes it easily searchable. Search results can also be filtered based on their importance to IT environments using VMware's vRealize Operations.
VRealize Log Insight provides universal log collection by connecting to any device in an IT environment. VRealize Log Insight can be installed on operating systems like Linux and Windows.
VRealize Log Insight has native support for vSphere, as well. This gives IT teams access to logs of their virtualized infrastructures and applications, as well as other products in the suite, such as vCenter and the virtualization server, ESXi.
VRealize Log Insight is designed for extensibility. VMware offers a marketplace for content packs, which can connect vRealize Log Insight to other VMware tools and expand monitoring in an IT infrastructure that vRealize Log Insight might not be able to monitor. For example, a content pack is available for Apache HTTP servers, for Microsoft Windows OS, for Cisco ASA Series Firewalls and more.
Each deployed vRealize Log Insight node can support 15,000 events every second. The events that admins can monitor are categorized as all vSphere events, error events, warning events, events by hostname, events by cluster and warning events by cluster.
History and iterations of vRealize Log Insight
In the 2.0.5 iteration, vRealize Log Insight was known as VMware vCenter Log Insight. The name changed near the end of 2014 with the 2.5.0 update.
The 3.0 update enabled the software to process two times more data per second than in vRealize Log Insight 2.5 -- 15,000 events per second per node. The update also built on top of this by doubling the number of nodes that admins can include in a cluster. For example, a 12-node cluster could process 2.7 TB of data a day.
This update also included rolling upgrades, which enables cluster upgrades without needing to update each individual server. Highlighting Event Types was added by showing messages as single events when they contain similar structures.
The latest version of vRealize Log Insight is 4.6. This update includes support for up to 15 vCenter Servers per node. The software can now change the visibility of options on dashboard widgets. Additional APIs were also included; for example, APIs for creating alerts, deleting VIPs and more. The latest update also enables receiving RAW event messages without headers.
VRealize Log Insight vs. Splunk
Splunk is used for the collection, management and analysis of log data, and it offers similar features to vRealize Log Insight, such as correlating real-time data, optimizing search capabilities and generating visualizations such as graphs, reports, alerts and dashboards. Splunk also has a Splunk-based app store that increases its extensibility, similar to vRealize Log Insight's content packs.